
Share
TOP 17 Power BI Desktop Updates for 2019
There were just TOO many to choose from (251 to be exact)

I thought that this AM I would Quick dash off a blog post on the top features of Power BI for 2019. I mean, how many could there possibly be? I can remember many thrilling updates coming through, but I had no idea that there were THIS many updates last year. No wonder this is a full time job!!
Good thing I have Power BI to help me!!!

After gathering the details on the updates for Power BI Desktop for 2019, by my count, there were 251 updates in 2019. I rated each update on a scale of 1-100. The lowest value I gave any item was a 50 due to the limited use of the item. Items that I felt were base line expectations for a BI platform, I rated in the 70's. Features that I was delighted to use I put in the 80's, and features that brought some degree of game changer to the BI world I rated as 90-100.

The Power BI Desktop team released consistent numbers of Features each month with December being the highest number of features, and July and August being the lowest number of features released. NOTE: I could not find any details on a January 2019 release of Power BI Desktop.

When I broke out the features by Subject area, it was no wonder to see that Reporting, Data Connectivity, Visualizations and Analytics had the absolutely most number of features released in 2019. When looking at the Average Rating for the features, Other, Data Preparation, Modeling and Analytics were the top spots. This would mostly be due to the number of game changing features released in 2019 in each of these Subjects (and only partially due to my biased love for analytics).
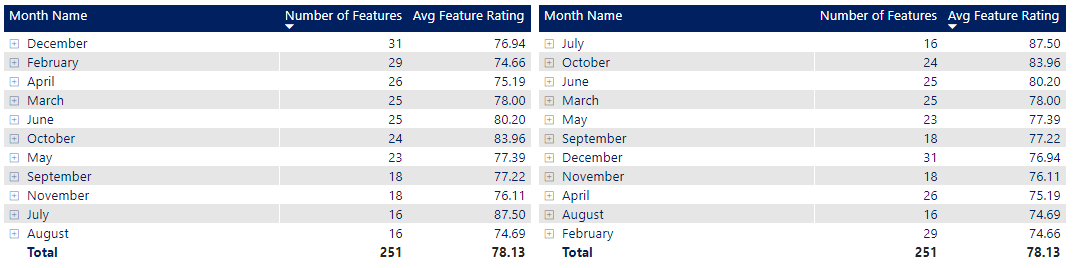
Looking at the features by month , quantity and average rating, I found it interesting that July, with the lowest number of features, had the highest average score for the features released.

In looking at the details of what was released in July, it's clear WHY July dominated the ratings chart. With Aggregations going GA, Power Apps visual getting certified, big updates to connectivity, and long waited for conditional formatting improvements all getting smashed into one month.

Enough of the analysis!!! Lets get on to why you clicked on this link.
TOP 17 Power BI Desktop Features of 2019 (by )
ANALYTICS
Aggregations- Generally available July
Drillthrough across reports April
Key Influencers- General availability August
Key Influencers visual (preview) February
The new Q&A visual October
DATA CONNECTIVITY
Azure Data Lake Storage Gen2 connector is now generally available December
Common Data Service connector is now generally available June
New Power Platform category within Get Data August
Power BI dataflows connector now generally available April
Power Platform Dataflows connector December
DATA PREPARATION
Query diagnostics October
OTHER
Modern ribbon (preview) November
Query performance improvements for DirectQuery models September
REPORTING
Decomposition tree visual (preview) November
Export current theme December
VISUALIZATION
PowerApps visual is now certified July
PowerApps visual now generally available September
PowerApps visual is now included by default October
Here are the Power BI Desktop posts used for this analysis. Enjoy!
January- no desktop update in January
https://powerbi.microsoft.com/en-us/blog/power-bi-service-and-mobile-january-feature-summary/
February
https://powerbi.microsoft.com/en-us/blog/power-bi-desktop-february-2019-feature-summary/
March
https://powerbi.microsoft.com/en-us/blog/power-bi-desktop-march-2019-feature-summary/
April
https://powerbi.microsoft.com/en-us/blog/power-bi-desktop-april-2019-feature-summary/
May
https://powerbi.microsoft.com/en-us/blog/power-bi-desktop-may-2019-feature-summary/
June
https://powerbi.microsoft.com/en-us/blog/power-bi-desktop-june-2019-feature-summary/
July
https://powerbi.microsoft.com/en-us/blog/power-bi-desktop-july-2019-feature-summary/
August
https://powerbi.microsoft.com/en-us/blog/power-bi-desktop-august-2019-feature-summary/
September
https://powerbi.microsoft.com/en-us/blog/power-bi-desktop-september-2019-feature-summary/
October
https://powerbi.microsoft.com/en-us/blog/power-bi-desktop-october-2019-feature-summary/
November
https://powerbi.microsoft.com/en-us/blog/power-bi-desktop-november-2019-feature-summary/
December
https://powerbi.microsoft.com/en-us/blog/power-bi-desktop-december-2019-feature-summary/

CHRIS WAGNER, MBA MVP
Analytics Architect, Mentor, Leader, and Visionary


